Thursday’s Social Media Panel at The Futures Industry Association Expo in NYC

As social media increases the velocity of communications, financial institutions are getting more involved. Meanwhile, platforms such as StockTwits and Twitter are still relatively new and so the institutions themselves are faced with a myriad of questions and challenges around how to employ these tools.

On Thursday, I will join Chair, Diane Saucier (who is awesome btw) and four other distinguished panelists in a discussion titled Institutionalizing Social Media at the Futures Industry Association Expo in NYC.

If you are attending the Expo, come by and say hi and please check this presentation as it should be a good one.

Detes HERE.

spring

geese
geese on the roof doing some kind of freak dance


The Consumer Staples Bubble

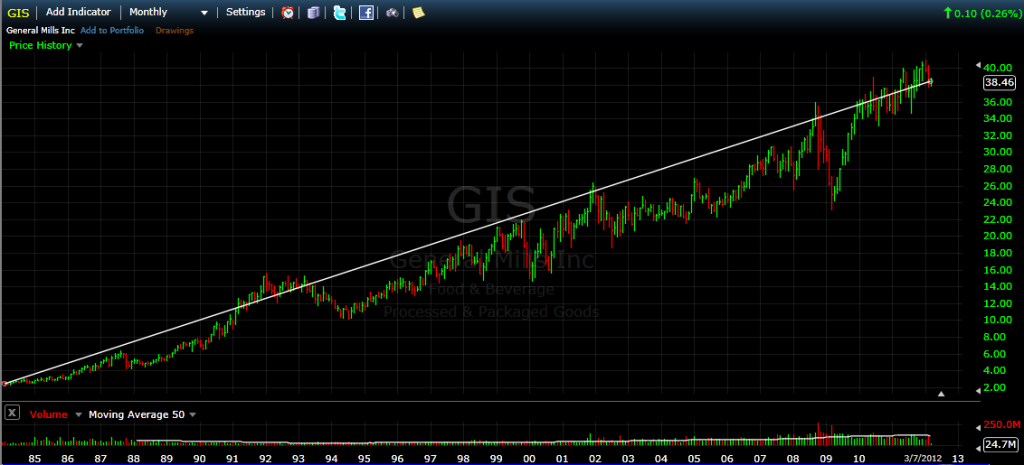
Early last year, I posted this 30 year General Mills ($GIS) chart.
generalmills

It was such a beauty and I bought some for the kids and retirement accounts.

The very long term trend is sublime, though in hindsight I’m sure those who bought in the middle of 2008 did not feel that way as even such a stable business lost more than 1/3 of its market cap while the financials were crashing.

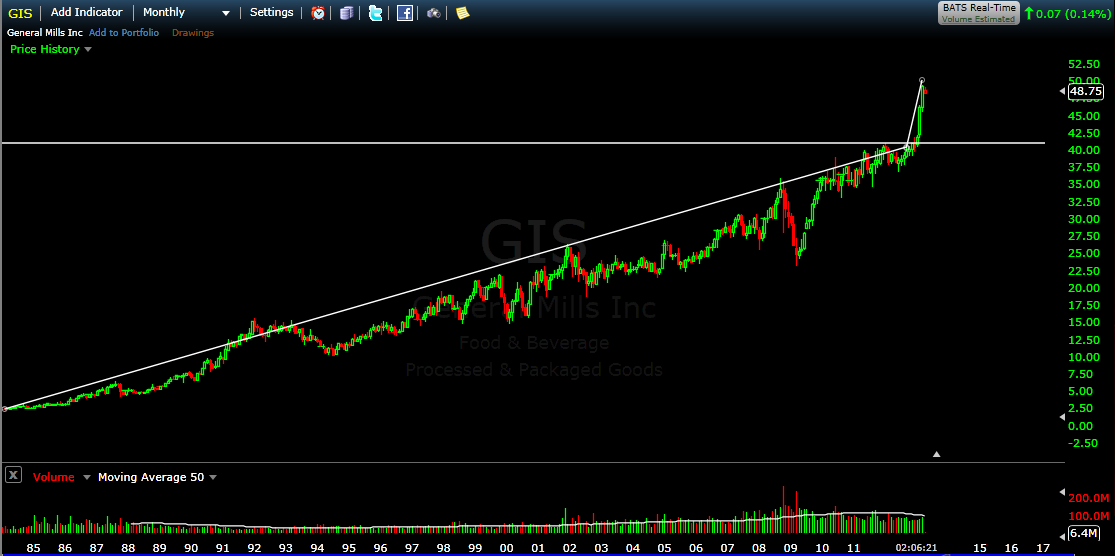
Fast forward this $GIS chart to today and we note another unusual deviation from the very long term trend line.
gis2

Since the beginning of the year, the slope of the trend has increased dramatically as $GIS and her cohort have begun behaving like momentum stocks.

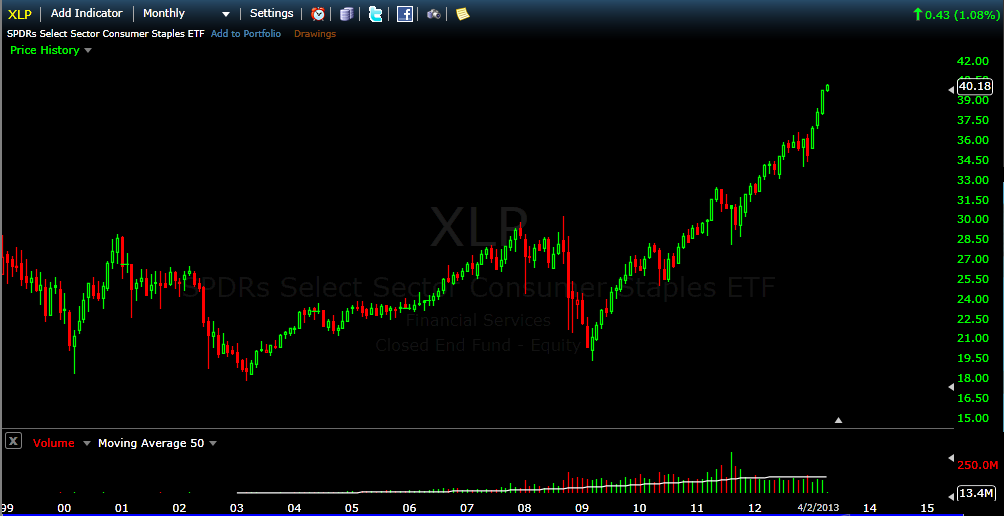
Here’s a 15 year chart of the staples ETF $XLP and you can again observe the increase in trend slope that has accelerated since the beginning of the year.
xlp

$XLP includes names like $PG, $PM $WMT $KO $COST et al and there are new momentum gems galore in the full list which is notable because consumer staples stocks are not usually momentum names but more defensive, dividend paying and stodgy.

So the $GIS rip coincides with price momentum among consumer staples as a whole as well as other defensive sectors namely health care.

Here’s 6 Takeaways from this most unlikely area gaining the mo…

1. There’s a bit of truth in every bubble that gets more and more distorted over time. You can think of it as the demonic charge or the thing that gets the bubble going in the first place until the price momentum takes on a life of its own.

With the NASDAQ bubble it was the real universe changing awesomeness of the internet. With the staples, it it the defensive aspect and dividends during a period when stocks seem unsafe and dividends are harder to come by.

2. The change in character among these names is not in and of itself healthy or unhealthy. It does though signal a deviation from normal asset behavior and where there is one deviation, others have usually already occurred or will occur either above or below the surface. You can even think about this boom, in part, as a derivative of sustained abnormally low rates.

3. This could last a while. These stocks are under owned and are not generally the focus of trader or media attention. As such, there is plenty of room for them to gain fashion with momentum crowds.

4. They will correct abnormally. Because you are getting increased volatility and volume, you will also get larger and faster corrections.

5. Nothing is immune to a bubble. Tech stocks are a lot sexier than Cheerio’s and when we think of the types of stocks that can get caught up in momentum, we usually would not think of these names as susceptible. Doesn’t really matter, does it?

6. In the loneg run, $GIS and the others that are right now becoming darlings will return to their longer term trends after the party and hang over are through. If you are a long term investor, there’s not much you really need to do here except maybe enjoy the ride while it lasts.

Related: General Mills: People Will Always Eat Cheerios


Best of StockTwits Charts: Leaders and Bleeders

Love love love pulling a few of this morning’s most interesting studies from The StockTwits Charts Streams for your viewing pleasure….

1. All Time Highs Tend To Beget All Time Highs: Call it momentum, inertia, positive feedback loops or whatever, markets (and stocks) that make new highs have a tendency to continue higher. This is the stuff that trend trading is made of. Here, @RyanDetrick provides clear cut backtesting stats to clarify the phenomenon on the S&P 500. He writes, “When $SPY closes at an all-time high, it actually outperforms average returns on all time frames.” See his work below:

All Time Highs

2. Continued Defensive Leadership: Recently, traders and the media have been focusing more and more on the leadership of traditionally defensive sectors, in particular Health Care ($XLV) & Consumer Staples ($XLP). Since the beginning of the year, these sectors have extended their leadership no doubt.  Key here though, and what few are mentioning, these sectors have been leading since the big 2009 bottom.  @Ivanhoff makes it abundantly clear here:

xlpxlv

3. For Example, HCA Holdings Beast: @JBoorman zeroes in on one healthcare stock in particular, $HCA, and notes the incredible recent strength in the name, “10 straight up days, 7 straight all time highs…”

HCA

4. Index Halitosis: To curb our enthusiasm a bit, here’s @MarzBonfire displaying a pesky set of divergences that he doesn’t like seeing while stocks make all time highs. Decliners are advancing and advancers are declining:

breadth


Sooo Bullish: Individual Investors Raise Cash While Stocks Make New Highs

On the last day of the 1st Quarter, the S&P 500 finally made its much anticipated All Time Closing High joining the Russell 2000 and the Dow Jones Industrial Average which made all time closing highs earlier this year.

Meanwhile though, individual investors continue to raise cash.

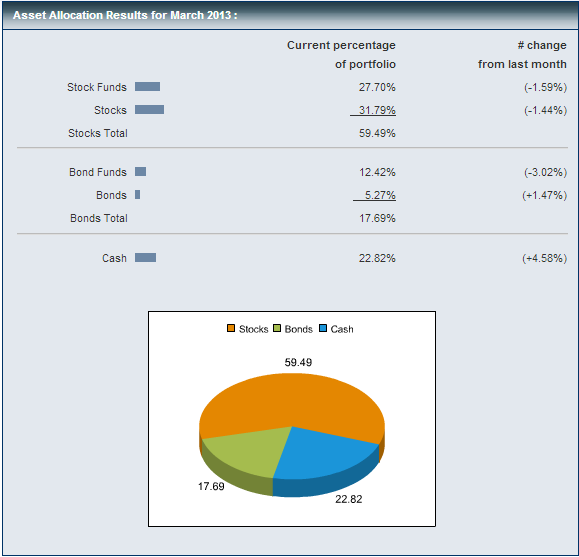
In the March data, published by The American Association of Individual Investors, cash grew by 4.58% while money allocated to stocks and stock funds declined by 3.03%.

aaiiasset

You have a combination of stocks making all time highs and individuals increasing their cash positions and decreasing their equity risk exposure. Bearish persistence still at work and not the thing that tops are made of.

Read: March AAII Asset Allocations Survey (AAII Blog)


The Best Media April Fools Joke of All Time

Way back in the day, way before the internet, Sport Illustrated published a story by George Plimpton about a baseball player named Sidd Finch, a Buddhist, signed by the Mets, with a 168mph fastball.

The year was 1985, I was 17, and I recall coming home from school and my older brother and his friends were reading SI and going nuts over the prospects of this being true.

The Mets were in on the gag too and here is a pic of the fictitious Finch with pitching coach Mel Stottlemyre:

sidd

Here’s the lead in to the article:

The secret cannot be kept much longer. Questions are being asked, and sooner rather than later the New York Mets management will have to produce a statement. It may have started unraveling in St. Petersburg, Fla. two weeks ago, on March 14, to be exact, when Mel Stottlemyre, the Met pitching coach, walked over to the 40-odd Met players doing their morning calisthenics at the Payson Field Complex not far from the Gulf of Mexico, a solitary figure among the pulsation of jumping jacks, and motioned three Mets to step out of the exercise. The three, all good prospects, were John Christensen, a 24-year-old outfielder; Dave Cochrane, a spare but muscular switch-hitting third baseman; and Lenny Dykstra, a swift centerfielder who may be the Mets’ lead-off man of the future.

and the link to the genius original: The Curious Case of Sidd Finch

HT: Adam Warner who reminded me of this classic.

End of Week Wrap With JC Parets

JC Parets and I have begun making end of week videos using the Google Hangouts.

They are quick, sharp and fun and we will get better and better at thm with every week I think.

In the latest one we discuss the S&P 500/Vietnam pairs trade, the Q1 underperformance of the financials and the Lulu Lemon short.

Check it and please feel free to provide feedback as we get this thing going:

$VNM $SPY $XLF $LULU


2nd Quarter Outlook: Waiting for Godot…

What are we doing here, that is the question. And we are blessed in this, that we happen to know the answer. Yes, in the immense confusion one thing alone is clear. We are waiting for Godot to come — ” – Samual Beckett

godotFew corrections have been more highly anticipated than the one we are all awaiting here. My great uncle Chuchum even asked me about it the other night at Sedar, “Boychkl, vooch with this correction?”
With so many so eager, no wonder it never gets here. Its like the watched pot or, to get more existential on you, Beckett’s Vladimir & Estragon waiting for Godot.

Well, if recent history is any guide, we’ll get it in q2 which begins with the opening bell on Monday morning. That’s a 65 trading day window and an eternity for many traders with a shorter time perspective, but if you are longer term oriented then you can afford to be patient and employ time to your advantage.

My view has been that we are in a bull market as a direct study of price behavior indicates. The $SPX is up 135% from the 2009 lows. That’s a bull.

Equities have been fueled by an astonishing percentage of money out of the market and in money market and treasury funds.  As I blogged in September, making a bullish case on the report that Fidelity’s bond and money market assets comprised more than half of the company’s 1.6 Trillion in managed assets:

Let’s think about this for a sec. The public hates the market so much that for the first time ever Fidelity has less of its AUM in equities than in bond and money market funds.

Furthermore, no one is talking about the epic level of dry powder this data point implies.

Despite 2012′s 15% $SPX rally, capital loss remains the primary emotional motivator of the investing public now.

Such an aversion does not get worked off overnight, or in a month, or in the 6 months since these numbers were reported.

Nevertheless, bull markets correct periodically and so will the current one and there is a rhythm.

Let’s use 2012 as an analog.

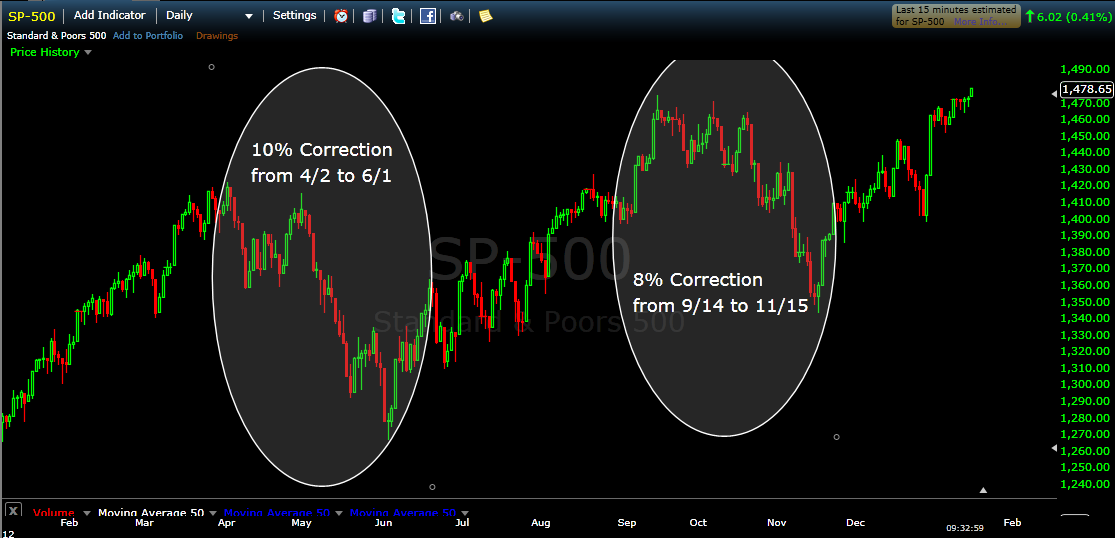
For Q1 2012, the $SPX was up 12% without a 5% pull back. For Q1 2013, the $SPX is up 10% without a 5% pull back. So far, a similar script. For the full year 2012, the $SPX did correct twice, once during Q2 for 10% and then again into Q4 for 8%. Rhythm.

2012corrections
In 2012, the S&P 500 corrected twice.

I expect the similarities between 2012 and 2013 to continue and that we will have a pair of corrections within the context of a bull market fueled by persistent loss eversion.

I have been gradually lightening positions since February expiration and so I am underinvested here and getting more so. I will be looking to scale back in when the market gets pummeled.

I risk missing a bull that never corrects. I’m good with that and for now I’m just waiting…

The European Noise Festival

If you are having difficulty deciphering noise from information, I will help you –

ITS ALL NOISE.

There are so many sources competing for your eyeballs and they will say anything to get you to allocate your precious time and energy that would be better spent focusing on your own method and goals.

The same exact thing was happening when I had dinner with Lydia more than a year ago and she said,

I’m done with Greece and don’t pay attention to it. I don’t care. Its in the market. It has been in the market. You can see it in equity prices. They don’t care either.

Well guess what, the $SPX is up 200 points since then and even if it was down 200, staring at Greece’s navel would have produced zero alpha.

You only have so many minutes and so much energy in a day and 98% of Cyprus and Europe were in the market by the close on Monday March 18th.

The world is so complex that no matter how smart you are and how many blogs you read, you will not have an information edge amid this glorious festival of noise.

$SPY $GREK $FXE

Load More Posts