Teaching Your Children About Stocks

This morning, I spent some time with my boys teaching them about the stock market. We do this from time to time and I think its worthwhile, especially if you are involved with markets on a daily basis, so that they gain some understanding of what you do.

I’ve written about this before here and focused on General Mills and Cheerio’s which is a breakfast cereal they eat all the time and so are very familiar with. A note about that piece that I didn’t mention at the time. Kids, even young ones, have the ability, to varying degrees depending on their developmental level, to recognize patterns and so they will get price behavior analysis much better than you might think. You will be surprised. :)

This morning we took a look at Disney, which is of natural interest to them too. I bought them each a few shares of the stock and from time to time we take a look to see how its doing.

Disney is a natural for them because they love Mickey Mouse, Lightening McQueen, Spiderman and the like and this morning we focused on 2 areas.

1) Some large companies are made up of multiple businesses and so we looked at Pixar, Marvel and the theme parks.

2) We examined market capitalization as a product of share value times total number of shares. We broke out the calculator and a piece of paper and pencil, and multiplied 64.73 (share price) x 1.8B (shares outstanding) and compared our answer to market cap.

So we got some conglomerate corporate structure and some serious math in which was nice.

Some keys to the process:

1. Choose a company that kids have an interest in. Disney and General Mills are natural choices. Here’s a pic of Max from this morning wearing his Spiderman suit so you know he gets Marvel which is owned by Disney.


 max1


2. Join them where they are cognitively. Here’s a simple way to gauge what your kid can and can not understand. If you begin showing them something and they change the subject, they don’t get it so move on. If they ask you a question, then you have them hooked.

3. Buy them a few shares of companies they might be interested in and show them that you have done this in their account. In general, they love this and they might even ask you to look at the price from time to time or even the stock chart if you have shown them this before.

4. Just have fun with it. Everything is play to a kid. So if you play stocks with them, they wll join the game.

5. If you are a commodities trader, introduce them to Cocoa Futures. They probably love chocolate. :)

$DIS $GIS $CC_F


Fridays With All Star Charts

On this week’s Hangout, JC & I discuss the S&P 500 – still holding the critical 1670, regional banks – showing signs of weakness, natural gas – reversal in progress & preseason football – w00t!

Have a look:

$SPY $KRE $NG_F $BBRY


Market Shrinkologicals: Bill Ackman On Tilt

Some of you are familiar with the on tilt phenomenon from the poker world.

If you’re not, it goes like this. Tilt sometimes occurs when a poker player experiences a bad beat or a series of them. After the beat, the player loosens dramatically playing more hands, increases risk irrationally and acts out. Often this leads to a quickly blown stack of chips.

This is not something that only novices do. If you ever watch The World Series of Poker on ESPN, you’ll occasionally see a pro lose a big pot and then, on the very next hand, get caught up in a hand that he or she should not be in.

You can see this happening now with Bill Ackman.

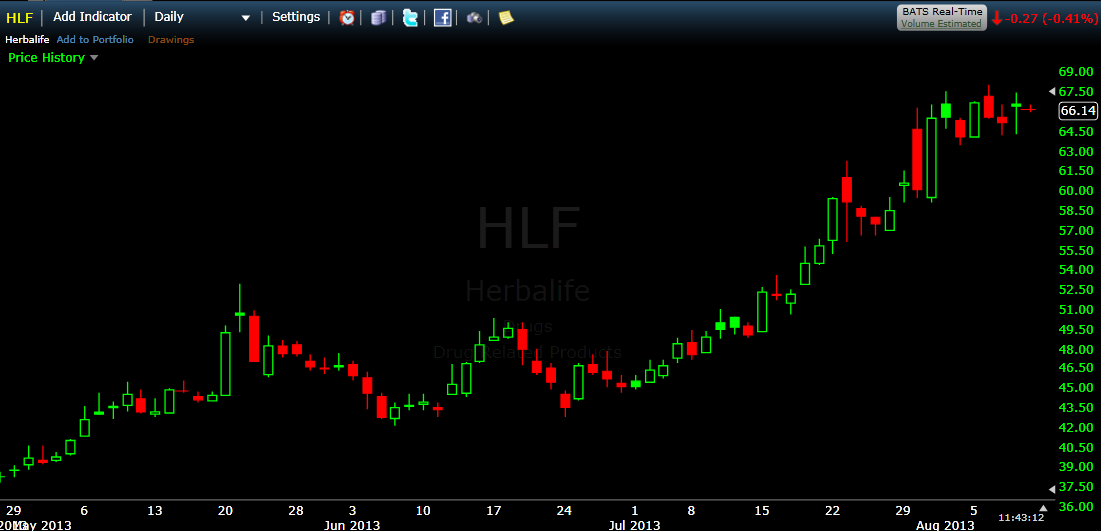
Ackman’s bad beat was (and still is) Herbalife where he is getting hammered by Icahn, Soros and a heavily shorted stock that looks great on the chart and keeps rising.

hlf
Herbalife continues to trade great after earnings.

So, onto the next hand, $JCP, where Ackman appears to be behaving irrationally.

As Jeff Mathews writes,

But his gambit yesterday—leaking on CNBC a letter to the board of JC Penney, of which his hedge fund is the largest shareholder, that urges pushing out the same CEO he just brought back (Myron Ullman) after pushing him out once before in favor of ex-Apple genius Ron Johnson, who pretty much destroyed the JC Penney as we knew it in favor of a slicker, more upscale thing called ‘JCP’ (the stock ticker, get it?) which JCP’s customers did not get at all, and from which they left in droves—smacks of desperation.

The dynamics of tilt can be understood best by way of prospect theory. Prospect Theory stems from the research of Kahneman & Tversky and suggests that humans sometimes neglect probabilities and make decisions based, in part, on whether they are framed by losses or gains. The implication is that humans are inherently loss averse and prefer to avoid losses at the cost of rational decision making.

Kahneman and Tversky put it this way: Losses loom larger than gains.

So people hate to lose and when they are faced with the prospect of loss, especially in a big way, they tend to act more on emotion  than expected utility. In the case of tilt, the player will try to avoid the realization of the lost chips by attempting to get them all back at once without consideration of the odds.

In the case of Bill Ackman, the $HLF loss is shaping up to be a big ugly bad beat and very public one, so not only are we seeing the behavioral effects of loss realization avoidance but we are also witnessing a large ego bruised at the hands of two of the biggest (Soros and Icahn) to ever play the game.

The rational response to a bad beat is to do less and risk less not more which would probably be the move for Ackman to make here until he can get his head together with the $HLF situation.


CME Group TV: The Massive Topping Process in Treasury Futures

Last night, JC Parets and I chatted at the CME Group’s NYMEX.

We backed up the lens and focused on Treasury futures and what a topping process looks like after a 30 plus year bull market in bonds. Its fascinating to watch this play out over an extended period and JC points out that 4% yield will be critical if and when we get that.

We also walked through weekly charts on Cocoa, which looks bullish here, and Gold.

Take a look:

$ZB_F $CC_F $GC_F


How Do You Know When a Stock Is Broken?

Damion asks…

Phil, How do you know when a stock is broken?

I asked a few esteemed friends who measure and trade price…

@alphatrends: 2 ways… 1. If a stock is making a series of lower highs and lower lows below a declining 50 day moving average. 2. If it gaps down at least 3% on twice its average volume and doesn’t recover quickly especially when accompanied by important news.

@stevenplace: A massive sell off in a stock is rarely a one off event.

@kimblecharting: Short term, when support breaks from a bearish rising wedge. Longer term, when support breaks from a bearish rising wedge and the stock breaks below 50, 100 & 200 moving averages.

@ryandetrick: If everyone is trying to pick a bottom, I know the stock is in trouble. Bottoms form on fear. If price is deteriorating and everyone is still bullish, trying to catch the knife – that is a big worry.

@ivanhoff: One investor’s garbage is another investor’s treasure, so the whole concept of a broken stock is subjective. That said, stocks that are making 52 week lows during a bull market are usually there for a reason. Stay away from them. When a high flyer breaks its uptrend, it is no man’s territory where momentum investors are gone or short and value investors are not yet interested.

@chessnwine: A stock is broken when it recklessly disregards logical levels of potential support after previously ebbing and flowing in an uptrend for a sustained period of time.

@annemarietrades: Broken stocks fail to recover near term relative support with each wave cycle. Weak upside action, sometimes seen by tall wick candles. Upside gaps fail to hold and fill quickly. 50 day simple moving average tests on the hourly charts continually fail. Fib retracements rarely recover more than 50% of downward waves.

@allstarcharts: A stock in an uptrend is broken once the primary uptrend line is breached and price breaks the next major pivot low. So, just because an uptrend line has been broken does not mean that the trend has reversed. Confirmation comes when price takes out the next pivot low and you officially have a series of lower lows and lower highs. Here’s a diagram:

8-6-13 broken stock@ppearlman: If a stock gets hit hard with heavy volume on a fundamental news event like an earnings miss, its a first sale is best sale situation.


Where Is The Stock Market Headed? Ask Me If I Care….

3blackbirds

I was of three minds,
Like a tree
In which there are three blackbirds.
– Wallace Stevens

OK, so the market is down which has been the rare event for months on end.

Every time we see even a one day sell off, bearish views come out of hibernation on my stream ranging from the apocalyptic to the sober and smart.

I have written about heightened sentiment volatility extensively already, but to summarize briefly – sentiment volatility is a big deal, because when bearish extremes occur quickly and on shallow corrections, it means that money is out of the market and might come back in just as quickly, ultimately fueling the start of the next leg higher.

I have no idea where the market goes next, although my broad bias is that we are in a bull market, and I am of three minds like Wallace Stevens’ tree. Key here is this – All the opinions I read, no matter how sober or how smart, are only guesses about the future based on an imperfect and unpredictable data set. This is classic decision making under uncertainty and it defines markets.

I don’t really care about not knowing, because I have a general strategy and tactics to support the strategy.

I want to wade into multi-day pull backs when they present themselves and sell calls for yield enhancement when the market is overbought. As a result of this being my approach, I am under-invested and have been to varying degrees for a while but that is alright.

Thanks to The Hooded Utilitarian who is the source of the above drawing. Check his post on the Stevens line I quoted above. Its a thoughtful read… 

Fridays with All Star Charts: Taking a Long Side Shot on the Blackberry

Good Morning Kids.

JC and I walked through a bunch of charts yesterday afternoon for your viewing pleasure.

The S&P500 looks great intermediate term while the Russell Small Cap is bumping up against big picture resistance.

On the global ETF front, JC likes the long Europe short China pair.

Finally, he’s taking a shot on Blackberry long and deploying options to clearly define risk.

Check out the vid:

$FEZ $FXI $BBRY $IWM $SPY


Load More Posts