What’s Your Bread And Butter Trade?

Sometimes, traders try to do many different things. Trade intraday, swing trade, short parabolic moves, buy break outs. Most of the time, its too much.

If you can find one or a few things that fit your personality and that give you an edge and you hone like crazy, practice and get better, you will find success.

So its no surprise that many of the best traders I know do a small number of things exceptionally well.

A couple years back, we wrote a book on the topic called The StockTwits Edge and it has tons of go to and in depth setups from some of the best of the StockTwits community.

More recently, I asked a few pros to share their bread and butter trades and here’s their responses…

@upsidetrader – One of my all time faves is buying the 200 period moving average on the daily or the 10 minute chart. It’s also a great place to get short for a trade on the pother side on those same two time frames when the moving average acts as resistance.

@Ivanhoff – One of my favorite setups involves scanning for relative strength on weak market days. Here are the specific characteristics I look for:

1) gains 2% or more when most stocks are down
2) breaks out to new 50-day high form a good side-ways base. New all-time highs is even better.
3) finishes the day near the highs of its daily range
Such types of stocks tend to outperform substantially. Recent examples include: $TASR, $AMAP and $RRGB.


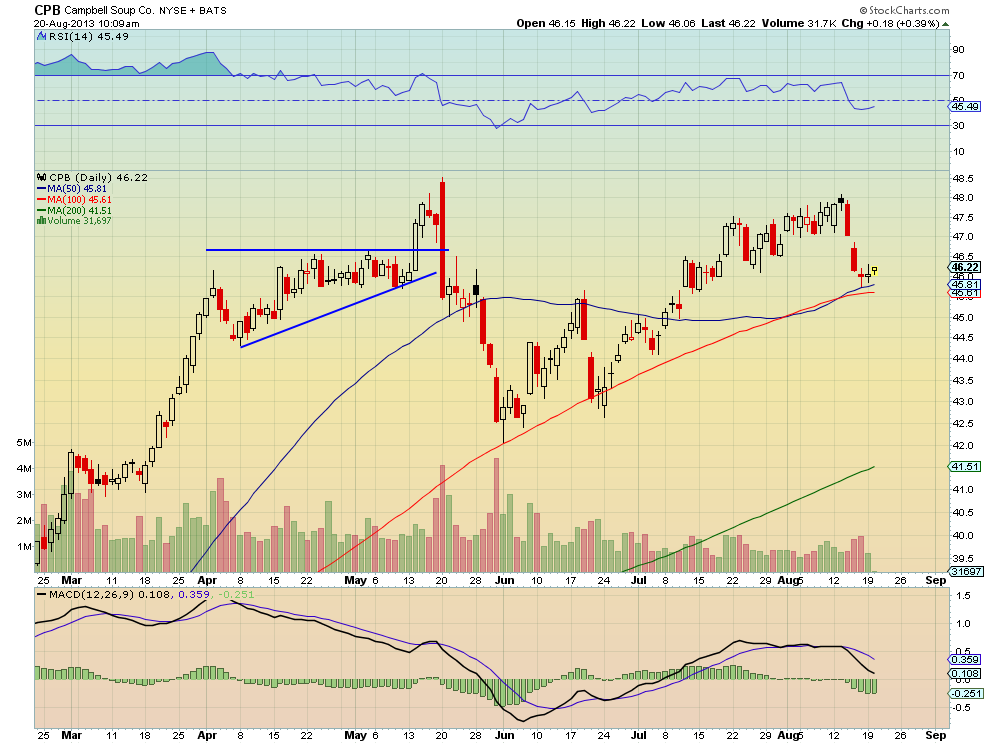
@HarmonGreg – Contrary to what many may think, from the short term trades I post on StockTwits, one of my favorite trades is focused on the oversold bounce on a long term position.  One that I adjusted this week was in Campbell’s Soup, $CPB.  It has a strong uptrend and a good dividend which makes it an attractive long term position.  Despite the good dividend yield it also occasionally offers the opportunity to add income.  As it gets extended from the Simple Moving Averages (SMA) it generally pulls back and finds support.  That is when the trade adjustment kicks in.

The 1×2 Call Spread

Last week Campbell’s Soup pulled back hard to the 50 and 100 day SMA.  When this happens with a stock I like to look for an opportunity to add a 1×2 Call Spread.  This is like buying a Call Spread for the rebound and also selling a Covered Call.  What makes this trade one of my favorites is that it can often be put on for free or a small credit.   For this stock I was able to buy a September 47/48 1×2 Call Spread, buying one September 47 Call and selling 2 September 48 Calls for a net credit of 3 cents.  If the stock rises above 48 by September Expiry I will get called away but also collect $1 for the Call Spread along side the Covered Call.  Anywhere between 47 and 48 I sell the Call Spread for what I can get and let the Covered Call expire.  Below 47 at expiry everything expires and i still own the stock.  For a long term position this is a win only trade!
cpb
Harmon’s $CPB Chart

@reddogt3live – The 80-20 Red Dog Reversal

@kimblecharting – My strategy is called TB&M which stands for “Tops, Bottoms and NO Middles”  I strive to find key turning points (at support or resistance) when sentiment is at extremes.
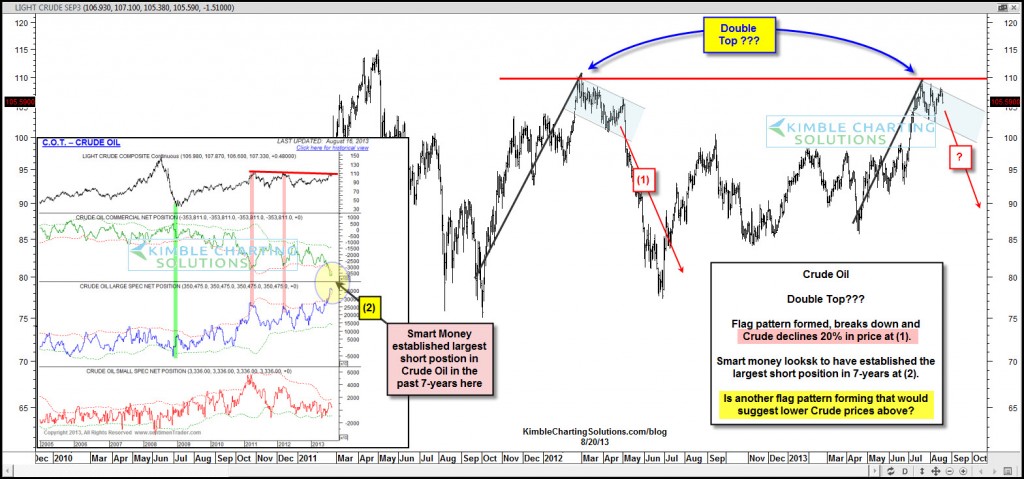
This approach gives investors  more often than not, a good risk reward entry point. Here’s an example:
Double Top in Crude Oil?
Smart money has established largest short position in 7-years.
Bearish flag pattern again? Last time this pattern took place Crude fell 20%
If this is a correct Power of the Pattern read, Crude Oil moves lower and
$DTO (the double short crude ETF) should do well!
kimblecrudeoil
Kimble’s Double Top in Crude Oil

@kiddynamiteblog -THE KNIFECATCHER! (Editor’s note: Kids, do not try this at home. :))

@RyanDetrick – “Looking for trades that move higher (or lower), amid negative (or positive) sentiment.  This shows there is still potential buying (or selling) pressure.  If there’s been significant put buying on an outperformer and it pulls back to an area of technical support AND big put open interest, that is a low risk/high reward entry.”

@allstarcharts – My Bread and Butter trade?

It starts with sentiment leaning in one direction. It’s the potential unwind of that sentiment that gets me to look a little closer. So in a downtrend, for example, the extreme bearishness would first catch my attention. New lows are put in to extend the downtrend, while momentum (I use RSI) puts in a higher low. This divergence between price and momentum is bullish and sets up the risk/reward opportunity that I’m looking for. You can make the same argument and trade with extreme bullishness in sentiment while a security is in an overextended uptrend that is not confirmed by momentum. In that case, I would look to short it.

The Euro and European stocks in summer of 2012 are a great example. Remember last summer when Greece was no longer going to exist and the Euro was being called, “an experimental currency”? Attached is the bearish cover of Barrons July 16, 2013 representing the sentiment at the time. Momentum was putting in higher lows as prices of the EUR/USD and Euro Stoxx 50 were making lower lows into July.

Well European stocks bottomed out the week after the Barrons cover to rally over 40% in the next 6 months and the EURUSD also bottomed that same week and ralled 14% over the same time period.

This is my favorite trade setup. And I was writing about it as it took place. See here and here.
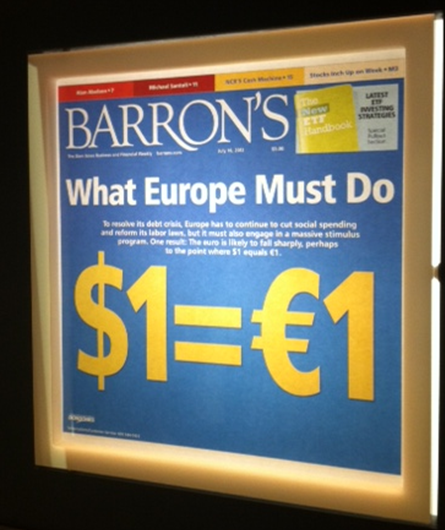
8-20-13 barrons cover july 16 2012


@alphatrends – After a stock in an uptrend has pulled back for 3-5 days I look to the intraday chart (usually 10 days 10 minutes) and watch for the short term pattern of lower highs and lower lows to be replaced by sideways price action.  As the stock becomes neutral on short term, the 5DMA begins to flatten out and I then look for a short term higher high (again identified on 10 minute timeframe) and then purchase at that level.

Ideally there will be a higher low within the last day or two which is fairly close (~1-1.5%) to set a stop under.  This setup often provides the best entry to a swingtrade because we can catch it as the short term momentum turns higher which puts it in alignment with the longer term uptrend.  At this purchase point we are not attempting to find the bottom of a pullback, instead we wait for the stock supply/demand to reach equilibrium and then turn higher, this minimizes price pullback risk.  We also minimize the risk of time because we do not buy in the neutral zone but instead join the trade as buyers re-establish control of the stock.
Once the trade is entered the job is then to manage the position, the initial stop assures us that any loss we may experience will be a small one.  The process of raising stops up under higher lows allows us to stay in the position while the pattern of higher highs and higher lows remains intact.


@RiskReversal  – An options trade that I like to employ when I can identify a catalyst for an individual stock is a calendar spread.  Recently in FB my thought was that $38 IPO price would offer fairly significant short term resistance after the stock’s 45% rise following better than expected Q2 results.  I am also of the belief that if the company is able to report better than expected results when they report Q3 earnings in mid to late Oct that the stock has another leg higher, possibly to the highs made on its iPO day back in May 2012.

Owning outright calls for an event 2-3 months out, after already identifying technical and psychological resistance at $38 could be a costly endeavor as the calls that you own could just sit and decay, costing you money.  This is where the calendar comes into play, I sell a shorter dated option of the same strike that I buy in the longer dated period.
FB Aug 17th /  Oct 38 Call Calendar for 1.30
-Sold 1 Aug 38 call at 1.20
-Bought 1 Oct 38 Call for 2.50
On Aug expiration this past Friday, the Aug 38 call expired worthless as the stock did in fact close below $38 and the Oct 38 call that I owned actually increased in value.  So then I decided to create another calendar by selling the Aug 23rd (this week expiration) 38 call at  .40, further reducing my cost basis and playing for the stock to stay below 38 on this Friday’s close and further reducing the cost of owning the Oct 38 Call that I am positioning for the the Q3 earnings event.  If this works out this week, I may look to then sell a higher strike call, in a shorter dated expiration or actually in Oct and create a vertical spread.
The whole point of the calendar spread is to lower the cost basis for the call that I want to own and minimize the potential for decay hurting your directional thesis.  There are lots of ways to win in this trade, and it can be profitable if the stock has no move or a small move higher or lower before the first expiration, but what you don’t want to happen is a massive move one way or the other, but either way your risk is capped at the premium spent on the spread.


$DTO $CPB $FB


Finance Bloggers Should Be Using Google Plus

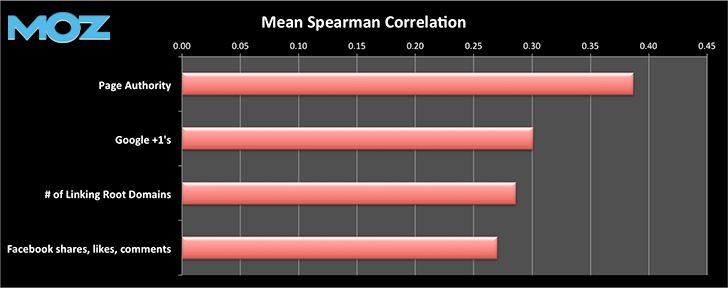
If you are dedicated to growing your blog traffic, then you will want to take a good look at the following chart from Moz Blog and ponder the implications.

Basically, the more +1’s you get, the more highly ranked your site will be in Google search.

moz

Moz also speculates that posting your links to G+ has a causal relationship with search rank and not just a correlation. This is profound and very smart by Google because over time, as content creators come to recognize the importance of G+ to their traffic, they will HAVE to use it.

So Google is leveraging search dominance in order to increase G+ usage.

If you are a financial content creator who is serious about building traffic, go and read the full piece. Also, be sure to read through the thoughtful and smart comments section.

$GOOG


Talking with Jay Zalowitz About The Amazon & Google Outages

My pal Jay understands this series of tubes that is the internet better than me and probably you. He pinged me 5 or 10 minutes into today’s Amazon outage telling me that if this goes on more than 15 or 20 minutes then its probably some kind of fairly large attack. So a few minutes later we hopped on the Google Hangouts and began talking about Amazon but wound up meandering to Google’s recent outage, the Zuckerberg hack & then onto a story about Lockheed & the Chinese Military…

Pretty cool stuff…

$AMZN $GOOG $LMT $FB


Greetings Comrades from the Halls of The Fed’s Propaganda Minister

Vasily_AksyonovI have no idea idea what that title means but I am reminded of a time in college when I had the chance to hear Vasily Aksyonov speak.

For those of you who do not know, Aksyonov was a great Russian author who penned a book called The Island of Crimea. This is top notch reading you’ve probably never heard of, btw, especially for those of you who are interested in dystopian literature with this whole Snowden/NSA thing.

Aksyonov, a Russian then living in Washington DC, remarked that no country reminded him of the USSR more than the US. I don’t think I fully got that at the time but now as I sit thinking about the Fed’s proximate move, I think of his words.

I am looking to see if the Fed steps up the dovish propaganda this week or soon. This will tell me a couple things.

1. If we start hearing dovish chatter from the Fed, it means they are at least concerned by the accelerating rally in Treasury yields.

& 2. If bonds fail to rally on such chatter, then the Fed is at least temporarily impotent.

Dasvidaniya comrades…

Fridays With All Star Charts: Best. Show. Ever.

Great little Google Hangouts with JC All Star Charts Parets.

We covered much ground including:

1. Seasonal weakness for the next year in the presidential cycle.

2. The possibility that $IBM is breaking down and the implications of that.

3. Coffee bottoming.

4. The deterioration in the percentage of stocks above the 200dma.

5. Implications of the recent breakdown in the correlation between regional banks and housing stocks.

6. The relationship between crude and natural gas.

Check out the vid:

$IBM $KC_F $KRE $XHB $CL_F $NG_F $SPY


Poll: Buy This Dip Or Run Like Hell?

Buy This Dip Or Run Like Hell?

  • Buy This Dip (61%, 222 Votes)
  • Run Like Hell (39%, 141 Votes)

Total Voters: 363

Loading ... Loading ...

CME Group TV: Crude Levels & Devils With Ray Carbone

Here’s today’s interview at The CME Group. I was joined by Paramount Options’ President Ray Carbone and we talked crude futures.

Ray’s biased higher and while he takes note of critical levels, the thesis he lays out revolves mostly around budding economic recoveries in China, noting the recent spike in iron ore, and the EU. He’s also minful of the uptick in violence in Iraq which is more important, he thinks, than Egypt, given increasing production there.

Take a look:

$CL_F $GC_F


Hyperloop, Return & Ridicule

The negative reaction to Elon Musk’s Hyperloop plans is no surprise to me. Pundits love to tell you why things won’t work. This is how they sell the advertising,

And sure, it sounds ridiculous, a 30 minute tube ride from LA to San Francisco or whatever. I’m sure if you would have told someone living in the late 19th century that their grandchildren would fly from NYC to Paris for their honeymoon, they would have thought you were crazy too.

People have a hard time imagining the future and that’s just human nature I guess.

Anyway, the negativity reminded me of this post from Fred Wilson who, for those who don’t know, has been an astute investor in early stage companies for the past 20 years. Think Twitter, Tumblr, Zynga and Mercado Libre just to name a few…

In his piece from earlier this year titled Return and Ridicule, Fred wrote,

I have found that return and ridicule are highly correlated over the years. We have made more money on things that were highly ridiculed than on any other cohort. When I see people laughing at ideas and companies we have backed, I smile. It means we are going to make a lot of money on that investment.

I saw Bill Gurley say that you can only make money by being right about something that most people think is wrong. His logic was that you can’t make money by being wrong. And you can’t make money by being right about something everyone else knows. So you have to be right about something that most people think is wrong. I really like that framework.

So I get really excited about the Hyperloop when I hear all of these reasons why it can’t work.


Sentiment Volatility Is The New Black: Bespoke’s Poll In The Context of Recent Bearish Spikes

Last week, the S&P 500 fell 1.06% to 1691.42 from the all time high close the week before of 1709.67.

Hardly a rout.

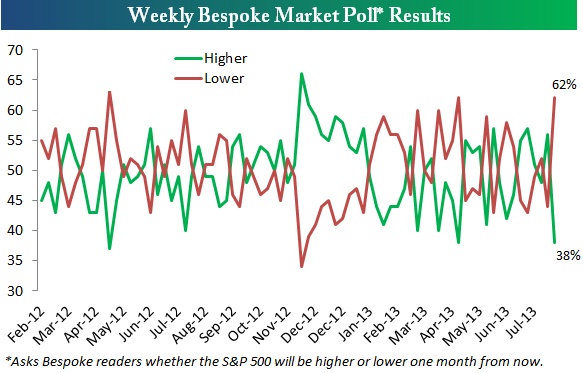
Yet, on this week’s Bespoke Sentiment Poll, bearishness hit a 2013 high with 62% of respondents seeing a lower $SPX one month out and 38% seeing higher. The week before, the reading stood at 56% bulls to 44% bears so there was a one week 18% increase in near term gloom.

bmphistorical812

This type of reflexive steep spike in bearishness has occurred all year on even the shallowest of dips and I have been writing and speaking about the phenomenon in detail since March. From my point of view, this is nothing less than the ingrained character of the collective market participant.

Two things matter here: 1) Traders and investors are innately anxious and get scared on the first sign of weakness and 2) These bearish spikes signal premature washouts and act like an index put, actually buoying the market and muting steeper declines.

Sure, we can get a larger correction and even take out the critical 1670’ish support on the S&P’s, but this is not how bull markets end.

$SPX $SPY


Load More Posts