Lov this one…
8 Fat Swine, 12 Fat Sheep, 2 Hogsheads of Wine…
Lov this one…
Earlier this week, I attended Ritholtz’s Big Picture Conference. Its my favorite event every year because the quality of the speakers is high, the audience is smart but Barry doesnt take it all too seriously.
Among the speakers, Michael Belkin, hipsterquantgenius & author of the Belkin Report, dropped this chart on page 41 of the 42 page doc he prepared to accompany his presentation. Take a good look:
Belkin writes,
One inter-market relationship we follow is the ratio of the S&P500 to the 10Yr TNote yield. This obscure ratio shows therelationship between stock prices and interest rates. The ratio can rise when interest rates are falling, to a certain point -which we label the breaking point. The widely-accepted notion that lower rates are positive for stock prices holds true untilthe S&P500/10Yr yield ratio reaches a major extreme – as it did in Mar 2008, April 2000 or July 1990. Bull markets (orbubbles) depend on this ratio expanding. When it reaches an extreme level (as in 2008, 2000 or 1990) and stops rising, amajor stock index decline can occur. In other words: There is a limit to a lower-interest rate boost for stock prices.
I’ve permalinked p. 41 of the report and I think you’ll want to click on over to read the rest of this portion of his packet.
$SPX $SPY
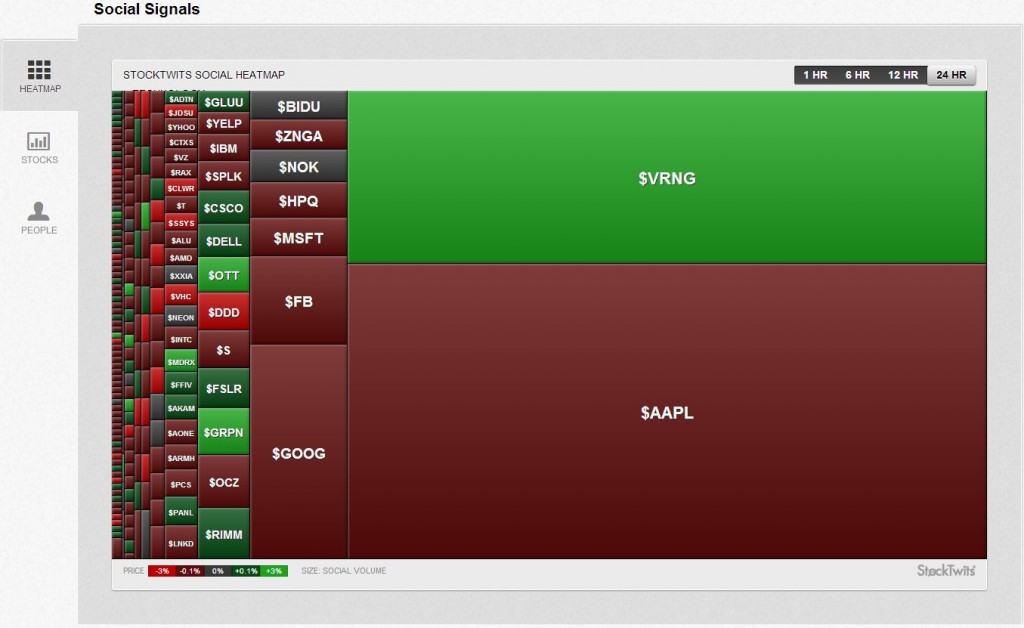
Sat down with James Altucher yesterday to discuss the Vringo ($VRNG) vs Google ($GOOG) case.
As I pointed out yesterday, main stream media is under covering this story while market participants are focusing on it like crazy.

It is incredible that I am still not hearing much about the $VRNG vs $GOOG story in the mainstream financial press.
I guess they don’t get it or they believe that $VRNG is too small of a company or whatever.
Meanwhile, the level of social momentum in this name on StockTwits has been truly spectacular for an extended period of time and shows no sign of let up.
While the stream has been a zoo at times, this avidly bullish majority has been right on the money.
Theyve been saying all along that this may be a much much bigger story than the usual unreliable sources have yet to recognize and I figure the MSM won’t get it until the story is over.
Then they’ll be all over it 
(no position)
On StockTwits, @FitzStock2004 holds court on $AAPL.
He has been dead on which may or may not continue but you have to hand it to him and, if you are involved, watch what he is saying and showing us on the StockTwits Charts Stream.
Behind the attitude and bluster (and he’s got plenty of those), there’s a pro who is putting the road work in, disciplined, and generously sharing his studies.
So here’s the weekend scene via The Fitz on $AAPL with multiple views & time frames (you can click on the charts to go to the full size study).
First the weekly provides perspective and here the stochastics are the thing…
Next, the close below both the 10 & 50 Day SMA’s
And finally, the big hairy Head & Shoulders on the 3 month…
 This Sunday morning at 10AM ET, I will discuss social media and trading at the T3 Live Super Conference at the Marriot Marquis in Times Square.
Social media tools are being employed by market participants around the globe in order to gather and process information faster, share trade ideas, vet strategies and learn.
I will teach how to employ social media tools like StockTwits most effectively to accelerate your learning curve and improve your P&L.
I’m honored to be speaking at the T3 Live Event as I have gotten to know Scott Redler well over the years and consider him to be a gifted technician and trader, a serious pro and a good friend.
You can sign up to attend HERE.
At the Value Investing Congress, the big media stories involve who the big guys are smacking down – Einhorn talking short $CMG or Buckley short $SPLK.
But some of the smartest themes unfold without the sex appeal, like landholding companies $HHC, $ALEX and $BPO.
These are great misunderstood stories and I was lucky enough to be able to take a few minutes to discuss the edge on these plays with Todd Sullivan of Rand Strategic Partners for ReutersTV.
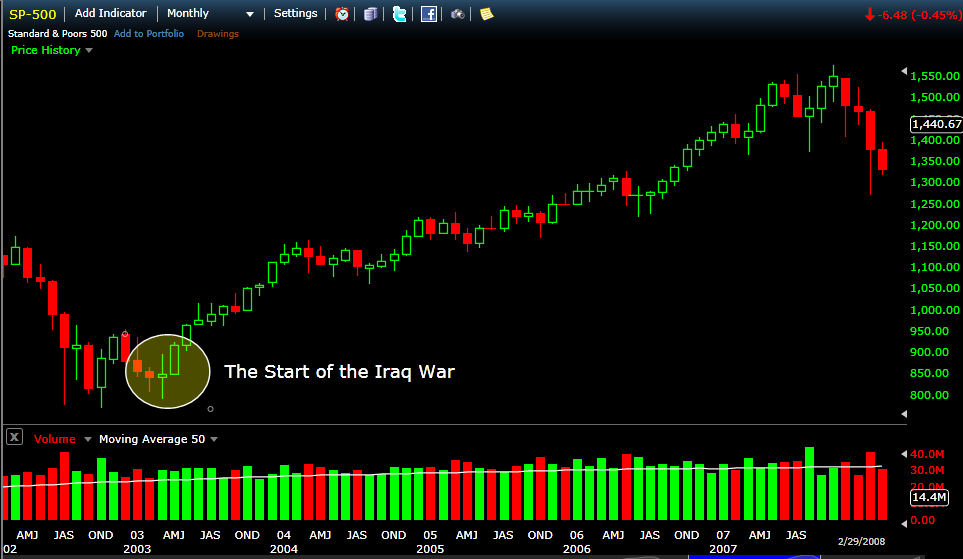
People recall the beginning of the Iraq War in the Spring of 2003 in many ways but few at the time thought of it as the bullish sign post it turned out to be.
Essentially the SP500 doubled from the start of the war to the peak 5.5 years later.

That’s the way it is with the best buy signals. Almost no one thinks of them that way because public sentiment is skewed in such a way as to not allow for the interpretation of data constructively.
Remember – thinking and feeling are intertwined – call it confirmation bias or whatever but sentiment shapes how we construe.
At the time in fact, the majority was spinning the news of war much more bearishly and as one more negative in a world already drowning in negatives.
Last week, Fidelity reported that more than half of its 1.6 Trillion dollars in AUM was made up of bond and money market assets.
Bond and money market assets at Boston-based Fidelity now total $848.9 billion, more than half of the company’s $1.6 trillion in managed assets. Ford O’Neil, a top bond manager at Fidelity, underscored the milestone on Wednesday during a media presentation in Boston.
The rise of bond and money market funds, including institutional assets, is a remarkable turn of events for Fidelity. The company built an empire in the 1980s and 1990s on stock funds and star stockpickers like Peter Lynch. Fidelity’s stock mutual funds held $761 billion at the end of June.
Let’s think about this for a sec. The public hates the market so much that for the first time ever Fidelity has less of its AUM in equities than in bond and money market funds.
Furthermore, no one is talking about the epic level of dry powder this data point implies.
Despite 2012’s 15% $SPX rally, capital loss remains the primary emotional motivator of the investing public now.
I have been writing about this for months and the Fidelity data is the investors’ behavioral expression of the fear.
And it feels characterological too. What I mean by that is that “fear of loss” appears to be deeply embedded in the public’s personality and as such resistant to change.
But it is not resistant to situational changes.
If and when the $SPX makes new highs (and its less than 10% from ATH’s), the predominant fear will shift hard and fast from fear of losing to fear of missing out.
Then, this epic level of dry powder suggested by the Fidelity news will light up equities and fuel momentum.
My pal Eric Jackson wrote a sharp piece comparing Facebook & Twitter over @ Forbes.
Eric has been negative $FB since before it was in and right as Spring rain about it.
Most recently, Eric riffs on how Twitter is already bigger than $FB and he focuses on mobile ad revenue and Twitter being the more mobile native.
Eric may be right, I’m not sure I buy it but still I love the smart provocation.
What I do know though, is that Instagram is bigger than Twitter.
Wait, what?
Check out the graphic from Ryan Tate’s excellent Wired piece entitled Instagram Use Is Exploding.
Tate also points out that Instagram is even more mobile native than Twitter and that it is growing absurdly fast.
As most of you know, $FB owns Instagram. When they bought ’em, I’m sure many believed $FB was overpaying big time and news later surfaced that Twitter was also in the fray bidding.
No wonder why.
Perhaps, Instagram is already worth more than either $FB or Twitter. 
If we buy into both Jackson’s piece and the implications of The Wired piece the logic goes something like this…
Twitter is bigger than Facebook.
Instagram is bigger than Twitter.
Therefore. Instagram is bigger than Facebook.
Just having a bit of fun y’all…. or am I?
Well, I can tell you unequivocally, a tulip bulb is worth whatever a buyer is willing to pay.
I bring it up this morning as I’ve tweaked the layout of this blog and added the tag line in the header:
8 Fat Swine, 12 Fat Sheep, 2 Hogsheads of wine…
This comes from a long list of items someone once paid for a single tulip bulb during the mania. Mackay published the full list in Extraordinary Popular Delusions and the Madness of Crowds, a book I highly recommend.
Mackay copied the full list from Munting, an industrious author living in 17th century Amsterdam and it always resonated with me.
I thought of it again recently as I happened across an academic paper written by Mark Hirschey entitled How Much Is a Tulip Worth?
Hirschey publishes the list but adds a column listing what each item is worth in 1998 US Dollars.
That’s 34k$ for a single bulb at the height of tulipmania. Nice.
I always loved the list because it was a vivid and poetic reminder to me of two things:
1. Value is relative.
2. Markets will remain, to widely varying degrees, irrational as long as humans are involved with them.
Now here’s a listing from Michigan Bulb dot com, one of hundreds of websites that sell them.
40 for 9.99$
That’s just less than a quarter a piece.