The Patriots Day Satellite Project

Let there be Boston Marathons everywhere!

Half of my stream, it seems, wants to run the Boston Marathon next year in a show of support after yesterday’s horrible attack. I love the sentiment and want to do it too.

Logistically though, if even 5% of the people who are now saying that they’d like to run it, enter and show up, it will extremely difficult if not impossible in Boston, especially with the heavy security that will be present.

But what if we begin to organize satellite marathons across the country and schedule them on the same day as next year’s Boston Marathon?

We can call it The Patriots Day Satellite Project.

This would be great as it would spread our solidarity and support everywhere and allow many more people to run but not add even more stress to next year’s Boston Marathon.

Seems like a no brainer.

I will be in contact with my local Road Runners club today and have more details by the end of the week.

If you would like to help organize, please leave a comment below or ping me at phil at stocktwits dot com.

Let’s do this!

On Gold: Conversation with Kitco’s Peter Hug

I had a quick conversation yesterday evening with Kitco’s global director of trading, Peter Hug.

Peter has been researching and trading the metals since before you were born and he knows the space from every angle. We covered much ground here including:

1. Tracing the catalyst for the selling in gold to Cyprus and the implications for the rest of Europe.
2. Reports of forced selling by funds getting margin calls and the trickle down there.
3. Near term technicals.
4. Global Macro factors related to Europe and the continuation of stimulus in the US and Japan.
5. Copper demand in China.

Watch here:

$GLD $SLV $JJC


Best of StockTwits Charts: Gold Crashes Edition

As you are all likely aware, gold is getting crushed, now down 125usd though off last night’s lows in the futures markets.

There have been hundreds of charts relating to the metal posted to The StockTwits Charts Stream in the last 24 hours and many of them are excellent.

I am posting a small sample here and focusing mostly on comparison charts. My thinking is that gold intertwines with other markets (currency, bonds, equities etc) in a complex way and so when we see a move like we have Friday and today, the changes in these relationships occurring as a result are worth noting.

First, Tim Turrenne (@cyclentrade) compares gold’s behavior to its history and contextualizes the extremity of the recent move noting, “more than 3 standard deviations outside the 200 day moving average is very rare.” Indeed:

cyclentrade

Next, Christopher Vecchio captures the recent divergence between the price of gold and the 10yr yield on a 6 year chart. He writes, “Gold decouples from US 10yr – are interest rates about to spike?” (note: the price of gold is inverted on this chart):

vecchio

Steven Place captures the relationship between the Dow Jones Industrial Average ($)DIA and $GLD. He writes, “Dow Jones priced in $GLD now at the highest levels since the 2008 crash:”

 djiagld

John Kicklighter measures “daily gold changes over the past decade” and this is by far the biggest:

kicklighter

JC Parets compares gold and silver, “the $GLD and $SLV ratio is right at the 50% retracement of the huge 2008-2011 down move:”

jc

Jaime Bermudez compares the recent gold move to its 20% crash in 1983 to 2013:

jaime

Last but not least, here’s an email @Trade2day1 received twice in the past two trading days from Optimus Futures. It suggests to me that traders are under extreme pressure with these large moves not only in gold but in crude as well:

goldemail


StockTwits All Stars: Talking Markets with Chris Kimble

Thrilled to do the Google Hangouts Session with Kimble Charting Solutions’ Chris Kimble.

For those of you who don’t know him, Chris is a master technician who weaves themes, from the global macro to the historical, through his work in an engaging, provocative and humorous way. We talked the stages of a bull, the Dollar/Yen, the Nikkei, commodities and bonds.

Seriously good…

$EWJ $USDJPY $JJC $GLD $TLT $JNK


Individual Investors Are An Emotional Wreck And It Is Astonishingly Bullish

aaiisurvey0410

The latest AAII Sentiment Survey again indicates extraordinary reactivity to price.

Last week, the major equity indices pulled back a bit with the S&P 500 losing 1.3% (intraday high to low), the $DJIA a little over .5%, the Nasdaq 2% & the Russell 2000 a little more than 3%.

In response to this shallow correction, however, the sentiment survey shows a huge spike in bearish sentiment of +26.3% from 28.2% to 54.5% while bullish sentiment decreased 16.2% to 19.3%.

While I have been writing and speaking extensively about the high sentiment reactivity for a while now and how it bouys equity prices, I am still surprised by the extremity of it evident in these numbers.

In an environment where sentiment shifts so much on such modest declines, the shift acts like a put or hedge against lower prices. Individual investors are an emotional wreck and it is astonishingly bullish.

Note: For all the latest on the AAII numbers and analysis I highly recommend following Charles Rotblut on StockTwits. He is a VP at AAII, does a great job covering the numbers and much more and he will answer your questions insightfully on the stream.

Related:

AAII Sentiment Survey

The Freudian Put

Behavioral Finance and the Freudian: An Interview with StockTwits’ Phil Pearlman

$SPY $IWM $DIA $QQQ


Best of StockTwits Charts: Bitcoin Crashes Edition

Today’s Bitcoin crash was captured exquisitely on the StockTwits Charts Stream.

First, @pinkhasov posts a screenshot of the spark that may have set off the crash, a denial of service attack on major bitcoin exchange sites:


500

Next, @jaquatech captures the majority of the damage with 4 hour candles:

candles

 Love this 24 hour view in 1 hour candles via @1nvestor as it shows how volatility increased with the slope of the decline. Classic crash pin action:

hourly

Next, this one, simply titled You Are Here and posted by @KarSun1, captures the bubble/crash cycle phenomenon generalized and speaks for itself:

youarehere

Finally, one last chart from @hakihika posted Tuesday still during the ascent and prophetically captioned, There is no way this doesn’t end in tears:

hakihika
“There is no way this doesn’t end in tears.”

Nice jobs fellas.


Bitcoin Is Crashing

bcoinn

 I have been posting these Bitcoin charts to StockTwits for a couple weeks now.

As I am writing, $BCOIN has crashed more than 100 points off its highs earlier this morning though I am sure by the time you are reading this the price will have changed drastically again.

This is not so much a currency but much more a pure distilled version of what animal spirits look like. It is a rare lens into speculation as element.

Let me quickly explain. Every extended overreaction (or bubble if you want to call it that) has a story and asset underlying the lunacy that has some value. In the case of the NASDAQ bubble, the internet was truly transformative though the price action obviously got way way way ahead of reality.

During the housing bubble, there were houses and real property.

But what if one could have separated any intrinsic value in the NASDAQ stocks or the houses from the speculative activity and looked only at the speculative activity? Well, we couldnt, not even in hindsight perfectly.

But with bitcoin we dont have to because there is no underlying asset, there is no intrinsic value.

So we are left with a hollow trading vehicle with limited liquidity getting moved purely by speculation.

Its glorious and tragic and why I am so interested.


Thursday’s Social Media Panel at The Futures Industry Association Expo in NYC

As social media increases the velocity of communications, financial institutions are getting more involved. Meanwhile, platforms such as StockTwits and Twitter are still relatively new and so the institutions themselves are faced with a myriad of questions and challenges around how to employ these tools.

On Thursday, I will join Chair, Diane Saucier (who is awesome btw) and four other distinguished panelists in a discussion titled Institutionalizing Social Media at the Futures Industry Association Expo in NYC.

If you are attending the Expo, come by and say hi and please check this presentation as it should be a good one.

Detes HERE.

spring

geese
geese on the roof doing some kind of freak dance


The Consumer Staples Bubble

Early last year, I posted this 30 year General Mills ($GIS) chart.

generalmills

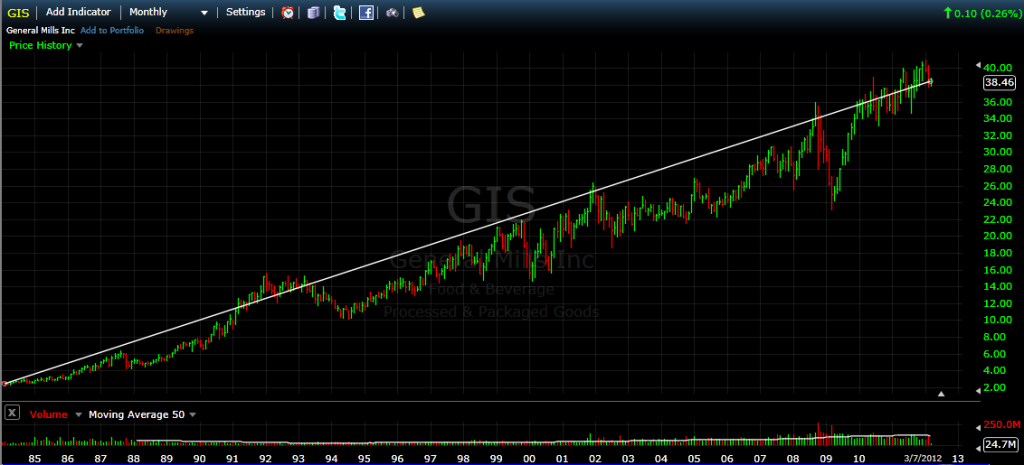
It was such a beauty and I bought some for the kids and retirement accounts.

The very long term trend is sublime, though in hindsight I’m sure those who bought in the middle of 2008 did not feel that way as even such a stable business lost more than 1/3 of its market cap while the financials were crashing.

Fast forward this $GIS chart to today and we note another unusual deviation from the very long term trend line.

gis2

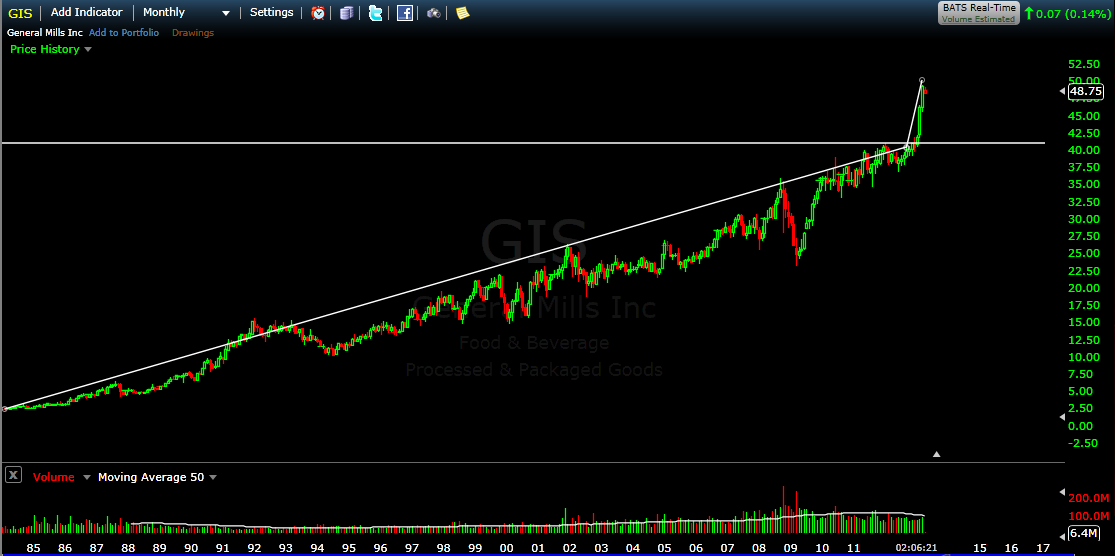
Since the beginning of the year, the slope of the trend has increased dramatically as $GIS and her cohort have begun behaving like momentum stocks.

Here’s a 15 year chart of the staples ETF $XLP and you can again observe the increase in trend slope that has accelerated since the beginning of the year.

xlp

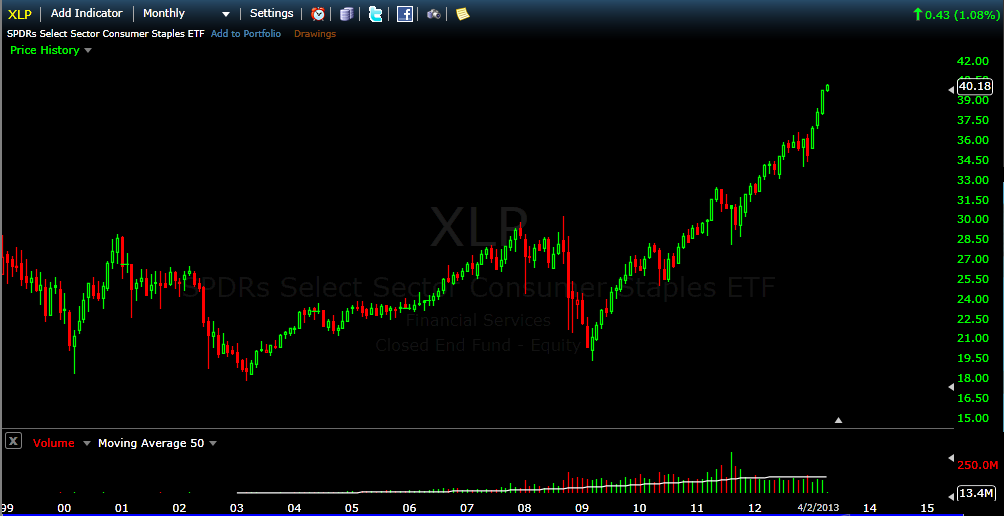
$XLP includes names like $PG, $PM $WMT $KO $COST et al and there are new momentum gems galore in the full list which is notable because consumer staples stocks are not usually momentum names but more defensive, dividend paying and stodgy.

So the $GIS rip coincides with price momentum among consumer staples as a whole as well as other defensive sectors namely health care.

Here’s 6 Takeaways from this most unlikely area gaining the mo…

1. There’s a bit of truth in every bubble that gets more and more distorted over time. You can think of it as the demonic charge or the thing that gets the bubble going in the first place until the price momentum takes on a life of its own.

With the NASDAQ bubble it was the real universe changing awesomeness of the internet. With the staples, it it the defensive aspect and dividends during a period when stocks seem unsafe and dividends are harder to come by.

2. The change in character among these names is not in and of itself healthy or unhealthy. It does though signal a deviation from normal asset behavior and where there is one deviation, others have usually already occurred or will occur either above or below the surface. You can even think about this boom, in part, as a derivative of sustained abnormally low rates.

3. This could last a while. These stocks are under owned and are not generally the focus of trader or media attention. As such, there is plenty of room for them to gain fashion with momentum crowds.

4. They will correct abnormally. Because you are getting increased volatility and volume, you will also get larger and faster corrections.

5. Nothing is immune to a bubble. Tech stocks are a lot sexier than Cheerio’s and when we think of the types of stocks that can get caught up in momentum, we usually would not think of these names as susceptible. Doesn’t really matter, does it?

6. In the loneg run, $GIS and the others that are right now becoming darlings will return to their longer term trends after the party and hang over are through. If you are a long term investor, there’s not much you really need to do here except maybe enjoy the ride while it lasts.

Related: General Mills: People Will Always Eat Cheerios


Load More Posts