 My pal Steve Hammer over at HFTAlert does phenomenal work identifying footprints in the tape.
You can also find his work on StockTwits and his chart stream there is among the most valuable on the site as he identifies buying and selling pressure imperceptible to the naked eye.
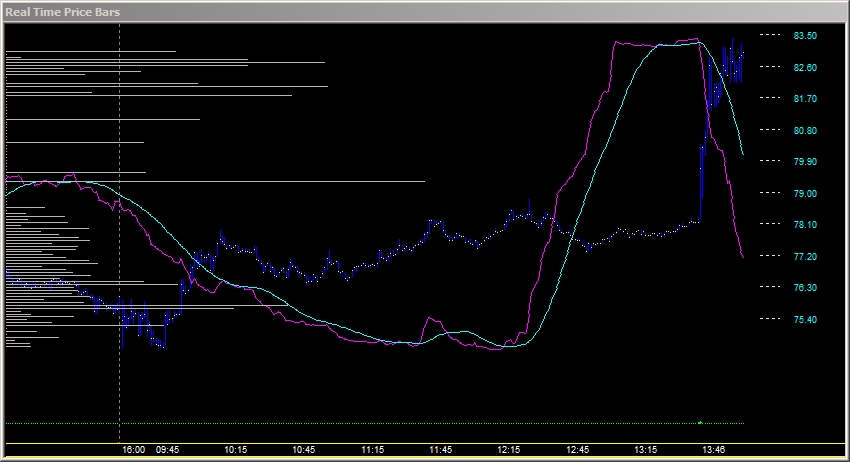
Yesterday, Steve posted this $NFLX intraday chart which shows his market pressure accumulator and the stock price.
I shot Steve an email asking him for a bit more color around this chart and here is what he sent me:
The $NFLX market pressure accumulator, which measures one aspect of demand, started rising at 12:15, then accelerated as the price of $NFLX slowly declined. A rise of this magnitude is significant because only institutional interest can drive the Accumulator this strongly higher. At 1:46 the shares began reacting to several rumors and rose sharply.
Information leaks to big money all the time. We all know this and sometimes identify clues in the options data beforehand.
Steve finds it in the tape which is pretty awesome.


