Especially these days, traders and investors alike can get caught up in the very near term during the trading week as price behavior shifts abruptly.
The weekend is a great time to back up the lens and take a longer term view while markets are closed and no decisions need to be made right here and right now.
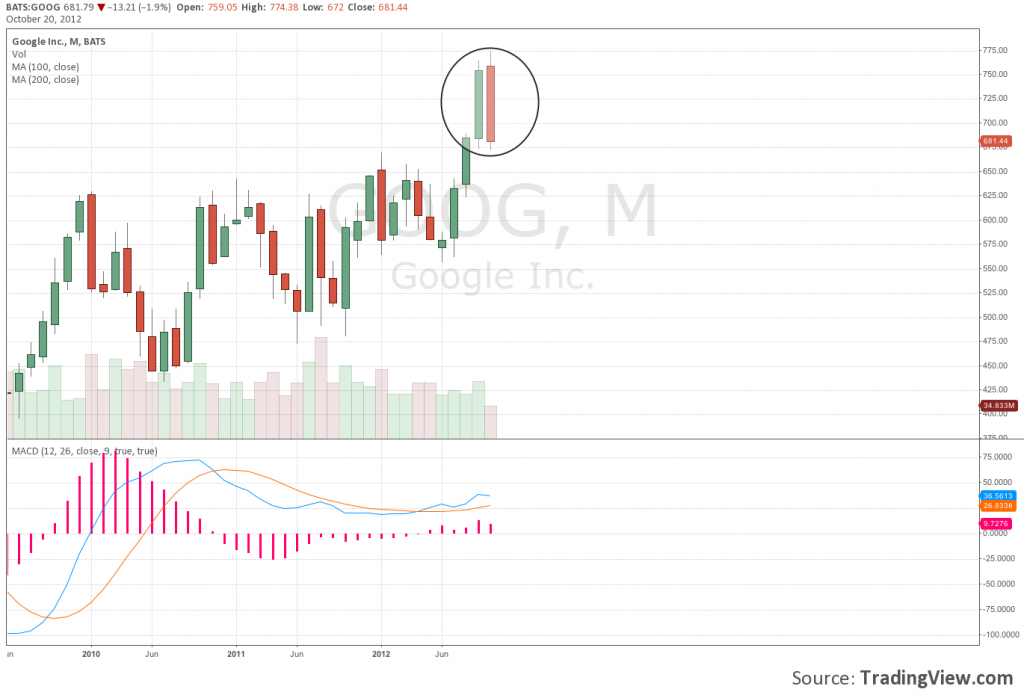
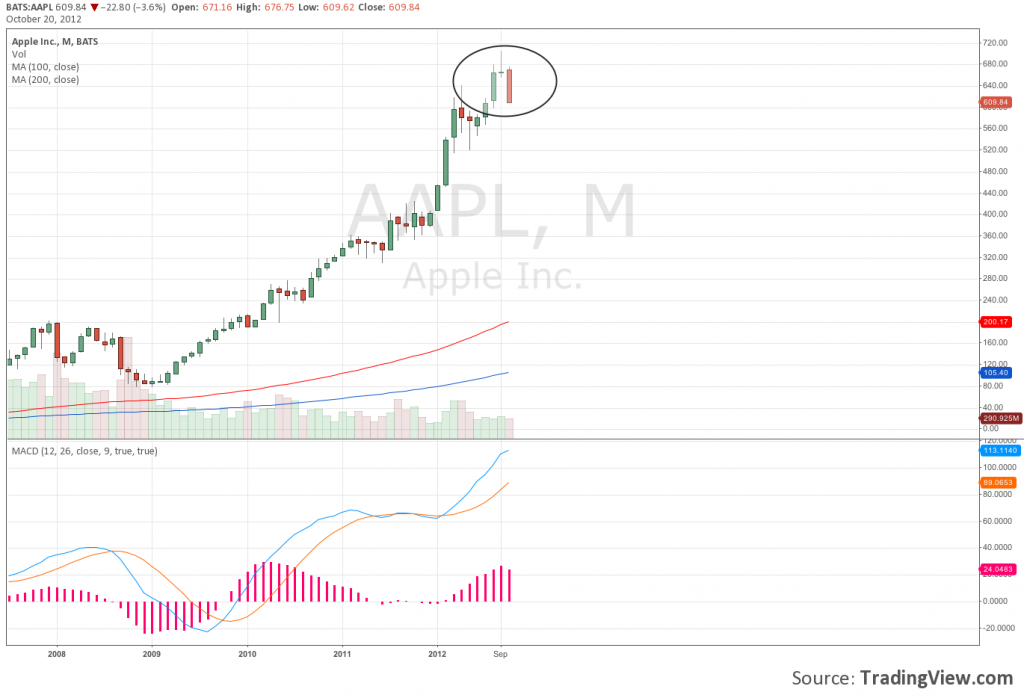
On the StockTwits Charts Stream, @berkek posted monthly charts of $AAPL & $GOOG, two of the most closely followed and widely held tech stocks in the universe.
And while the month is not quite over, we do get a sense of what October might portend.
First, Google where a “textbook bearish engulfing” is taking shape.
Next, the Apple monthly, where “An evening star is taking shape” and as @berkek adds, “time to move out.”
I would only add that the second candle in this pattern, September, also looks like a gravestone doji to me…
Neither of these patterns are confirmed until the end of the month…
For more on these candlestick patterns:


