


The weekends are a great time to back up the lens and gather some perspective especially at the end of a quarter.
Last night on Chartly, Todd Elias (@toddstrade) did just that, posting a series of quarterly charts which add time perspective and context.
Here’s a few of the most interesting ones:
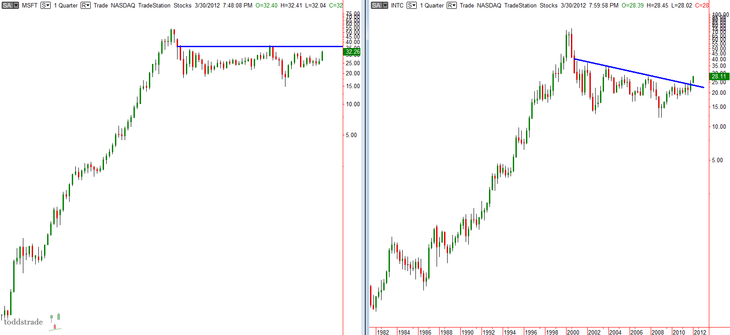
30 year charts of 2 of the 4 original four horsemen of the NASDAQ – $INTC and $MSFT.
These charts put the crash in perspective, provide a glimpse of how assets tend to act sometimes for years after a blow off top and also intimate the potential of a reemergance of leadership after those 10 years of dormancy.
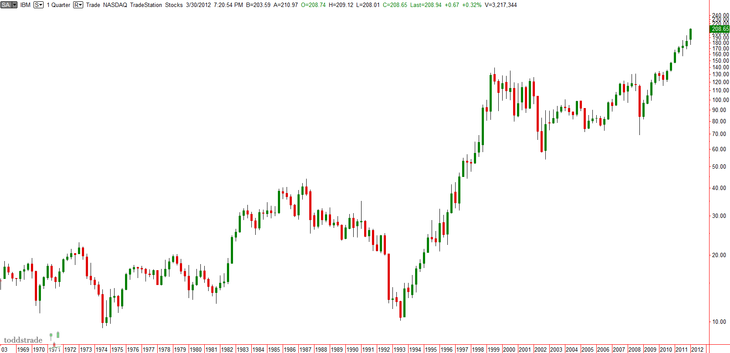
Its been 6 quarters already since $IBM took out its previous ATH set in late 1999. A leader –
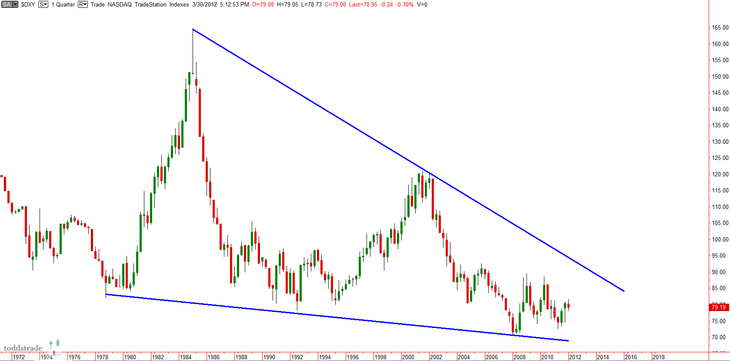
Massive Falling Wedge on the US Dollar – Love this one as we tend to watch movements here over much shorter time frames…
The implication here is that over the next year or two, we could see a bullish breakout in the $DX_F that’ll make your head spin and, perhaps, crush dollar denominated assets such as $GLD.
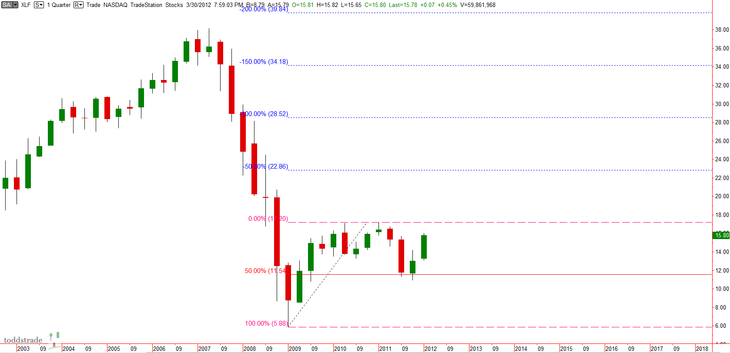
And finally, the banks with some perspective especially since the Q1 2009 bottom –
You can find the rest of Todd’s Quarterly charts all nicely chalked and smartly captioned HERE. He’s a great follow.
Also, check out Todd’s blog for seasoned perspectives and well reasoned setups…