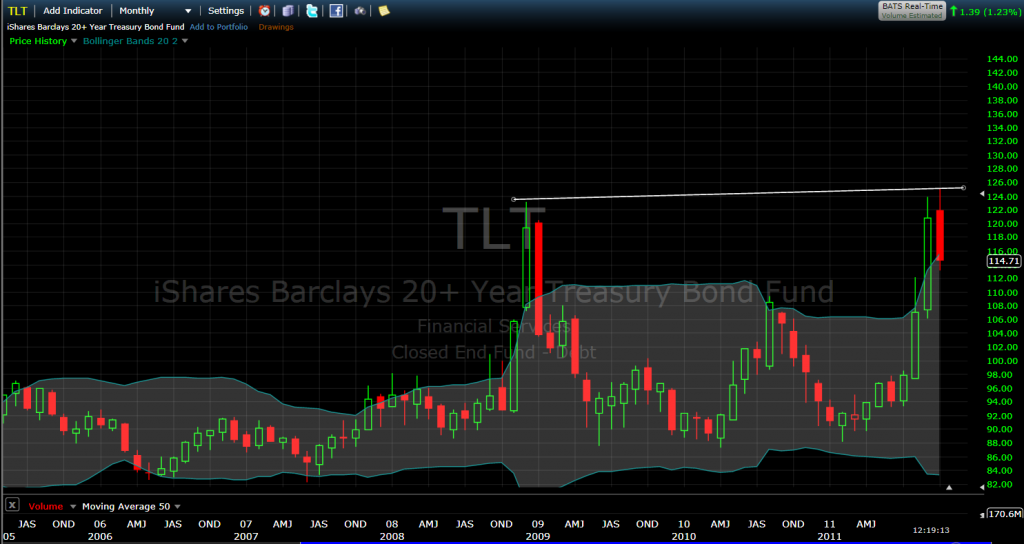
The treasury rally has lasted 30 years.
Might this chart be indicative of a massive double top and signal the end to one of the greatest trends in the history of debt investing?
All opinions welcome.

$TLT
8 Fat Swine, 12 Fat Sheep, 2 Hogsheads of Wine…
The treasury rally has lasted 30 years.
Might this chart be indicative of a massive double top and signal the end to one of the greatest trends in the history of debt investing?
All opinions welcome.

$TLT
Pingback: Tuesday links: purchase decisions | Abnormal Returns()
Pingback: Morning News: October 26, 2011 | Crossing Wall Street()
Pingback: Wide World of Charts | All Star Charts()