A quick price and position update on $GLD. I’m currently flat and looking to reestablish a long term position lower over an extended period of time.
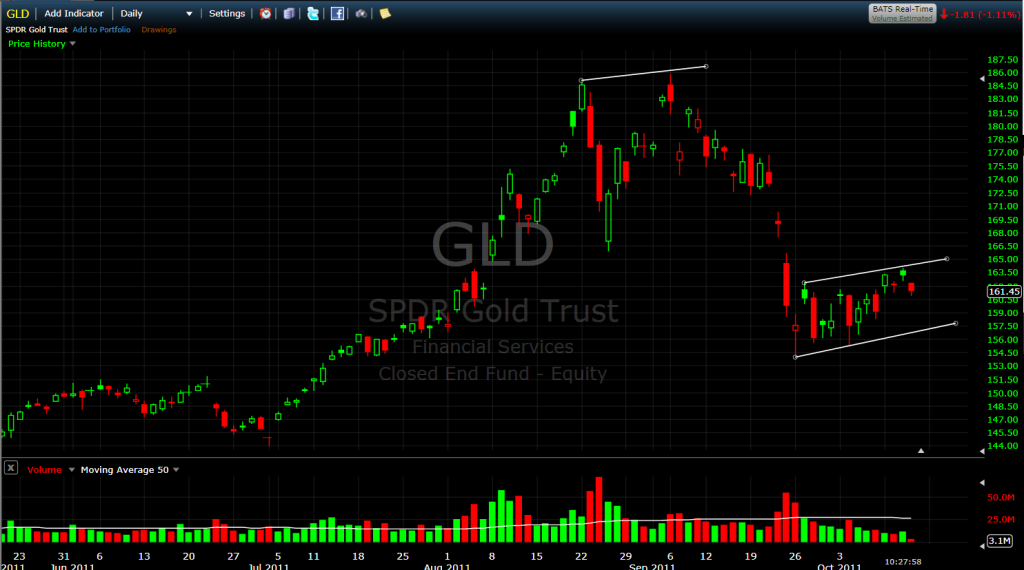
Last week, I posted this chart highlighting a potential bear flag. Below is an updated version of that chart with the upper level more clearly defined.
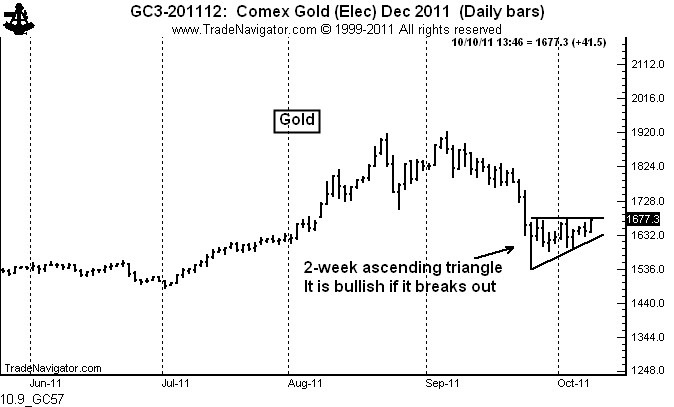
In contrast, Peter Brandt, who is a master technician, posted this $GC_F chart Monday on Chartly that continues to bare watching. It has a more constructive take on the recent consolidation after the precipitous sell off.

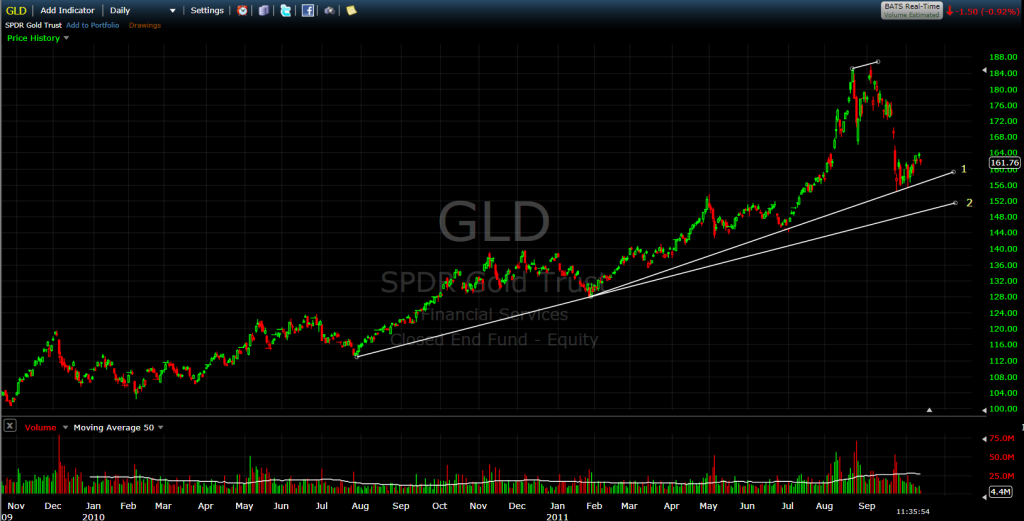
On a longer time frame, I am observing these trend lines.

1. This line drawn from the January low has been tested twice in the past month which may demarcate a double bottom.
2. This line drawn from the July 2010 low is approximately where I am looking to sell near dated puts on extreme weakness.
As an aside: I Love blogging this stuff out as it helps me clarify my point of view.


